Drawing the invisible — contour lines and Minard

A contour line is a lie your map tells you so you can understand the truth. No hill has a line around it. The line is what you draw when the hill refuses to fit on a flat page.
The history of that lie is longer than most people expect.
Pieter Bruinsz, 1584. The first known isobath — a line of equal water depth — was drawn for the Spaarne river near Haarlem. Not a coastline, not a road, not a boundary: a line representing a number. The same number everywhere along its length. This was a quiet invention. It didn’t look dramatic and it was not immediately copied.
Edmond Halley, 1701. The first published isogonic map, charting magnetic declination across the Atlantic. Halley’s lines connected points where a compass needle deviated the same number of degrees from true north. Again, not a physical feature — a property of the world, drawn as if it had edges.
Alexander von Humboldt, 1817. The isotherm map. Humboldt connected points of equal mean annual temperature across the globe and started what a later century called the “isoline craze” in cartography. Isotherms, isobars, isohyets — the nineteenth century found a new thing a line could mean, and used it for everything.
The endpoint of the genre is Charles Joseph Minard’s 1869 figurative map of Napoleon’s Russian campaign of 1812.
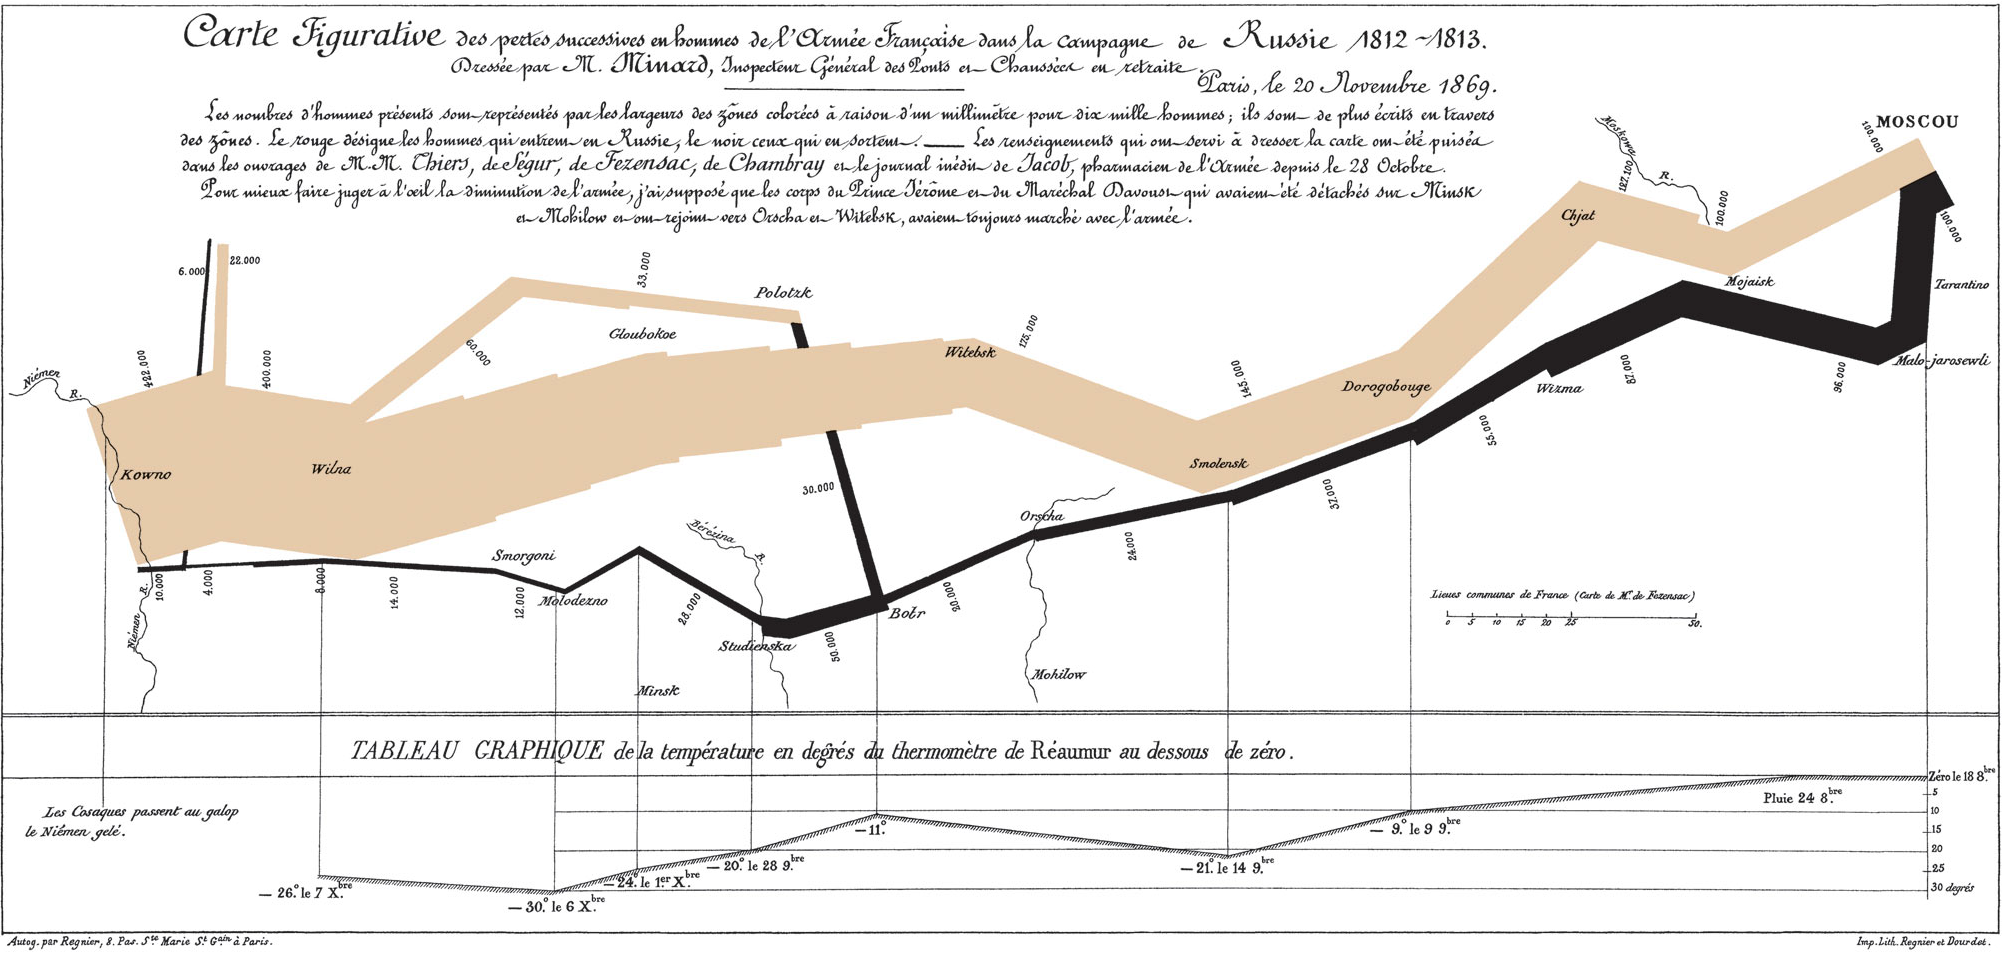
Six variables on a single sheet: army size, geographic location in two dimensions, direction of travel, date, and temperature during the retreat. The Grande Armée crosses the Niemen at 422,000 men. It returns with 10,000. The band shrinks across the page — literally, measurably, proportionally — and the temperature graph below it shows −30° at the worst crossings. Edward Tufte called it “the best statistical graphic ever drawn.” Minard’s contemporary Étienne-Jules Marey called it “a defiance of the pen of the historian in its brutal eloquence.”
None of these images is about lines. They are about quantities that can only be drawn as lines. The tool is incidental. Once that’s clear, contour mode in Vexy Lines stops being a stylistic option and starts being the thing cartography has been doing since 1584: making the invisible visible by giving it an edge.